
An open mapping tool from the Center for Land Economics
Your city's land,
in 3D.
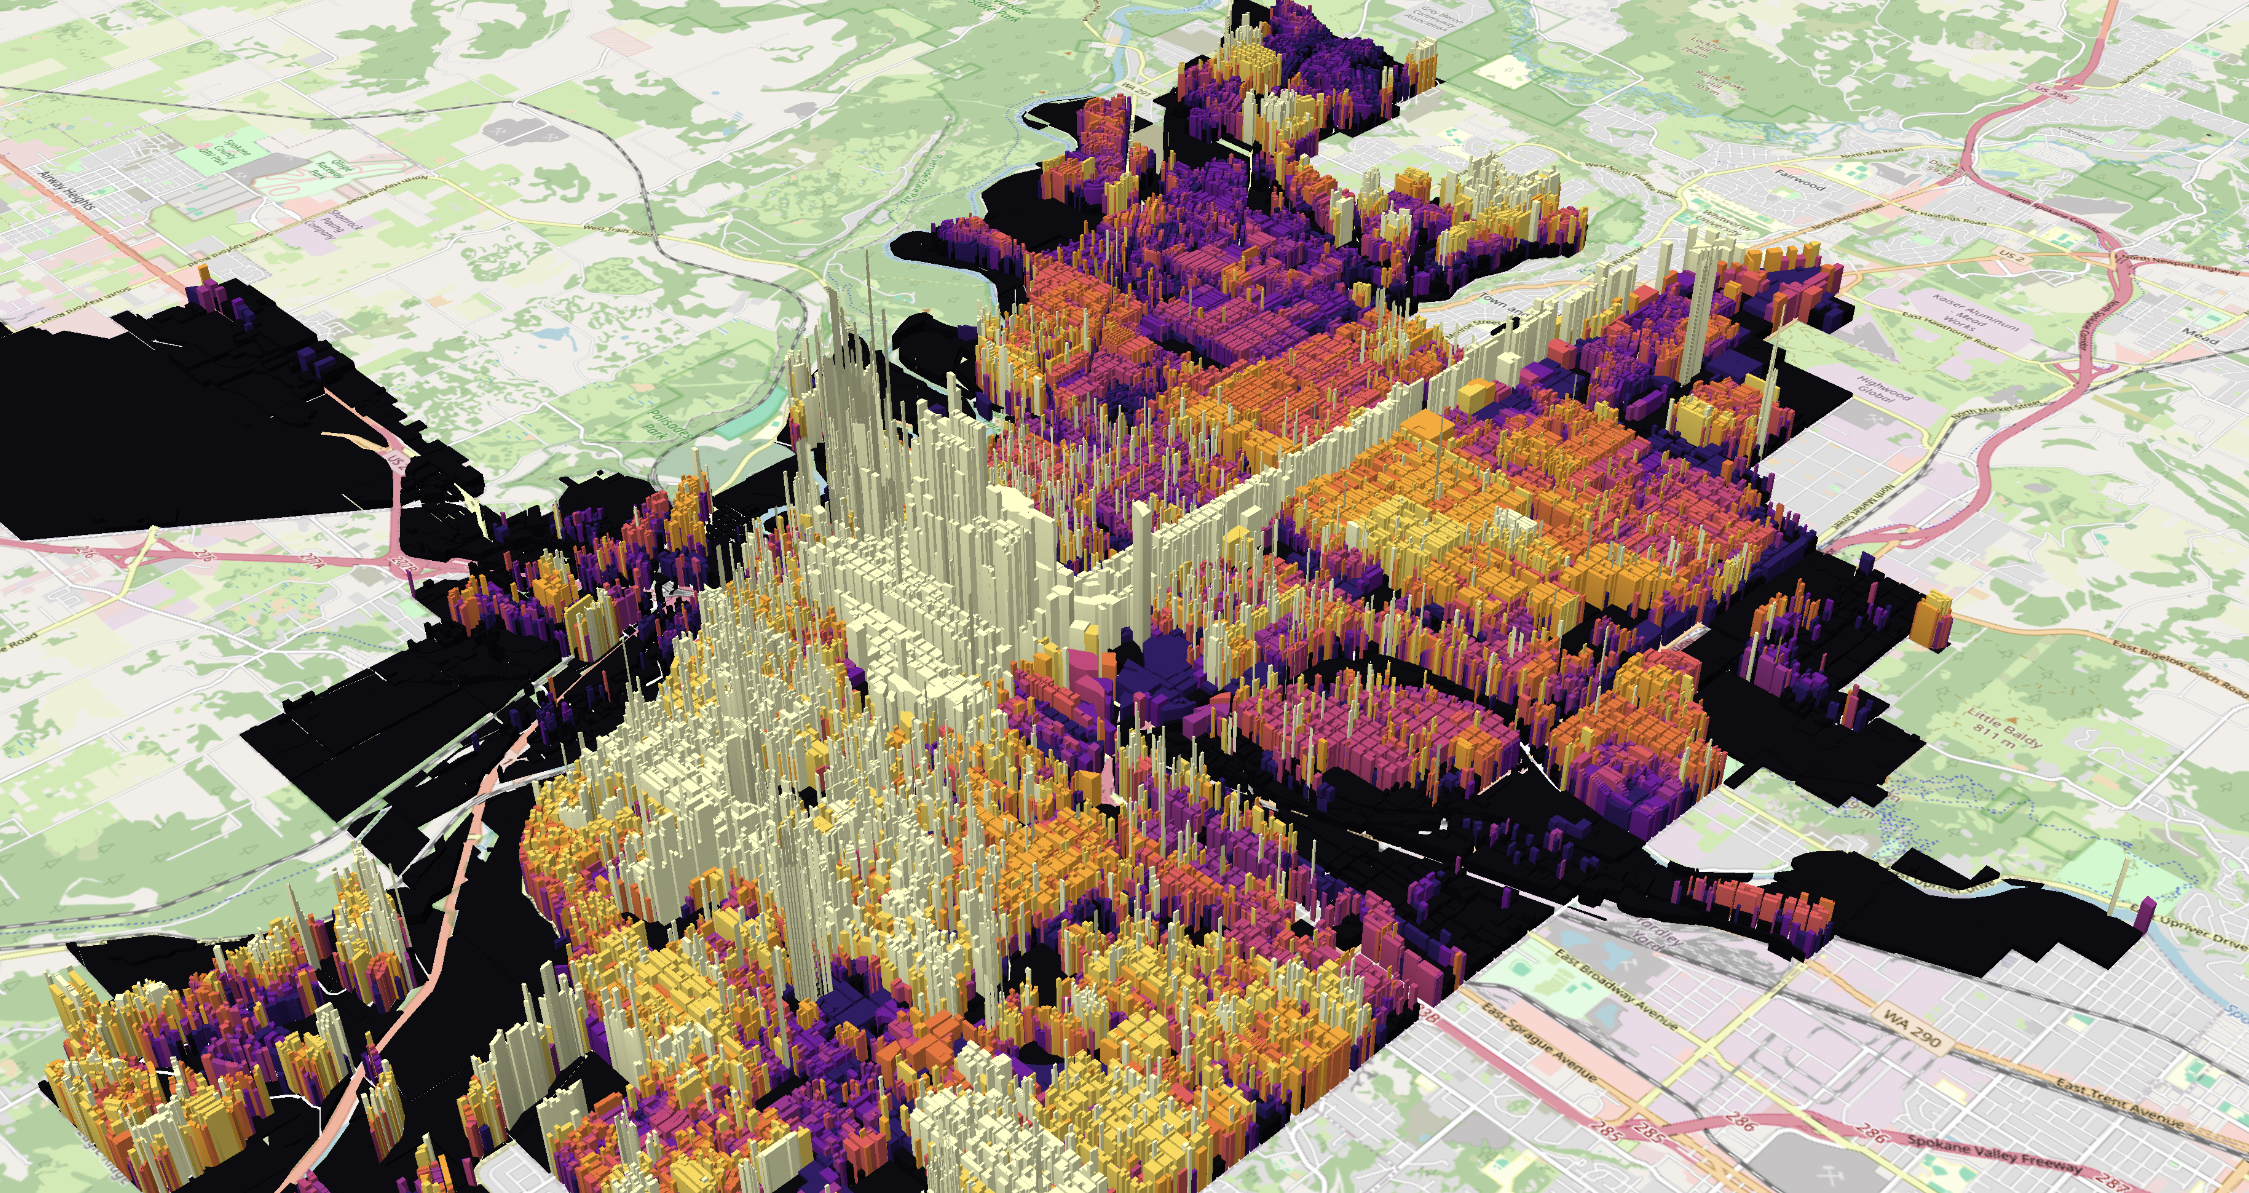
CivicMapper turns public assessment records into an interactive 3D map — revealing where land value concentrates, and how much sits idle beneath vacant lots and surface parking.
Launch CivicMapper25
Cities mapped
14
States
3
Analytical views
100%
Free & open
What it is
A clear picture of the land under a city
Most maps show buildings. CivicMapper shows the land — its assessed value, parcel by parcel — so planners, advocates, and residents can see where value is concentrated, where it is being captured, and where it is going to waste. It is the same data behind the Center for Land Economics' reform research, opened up for anyone to explore.
One map, three lenses
Three ways to read the same city
Land Value
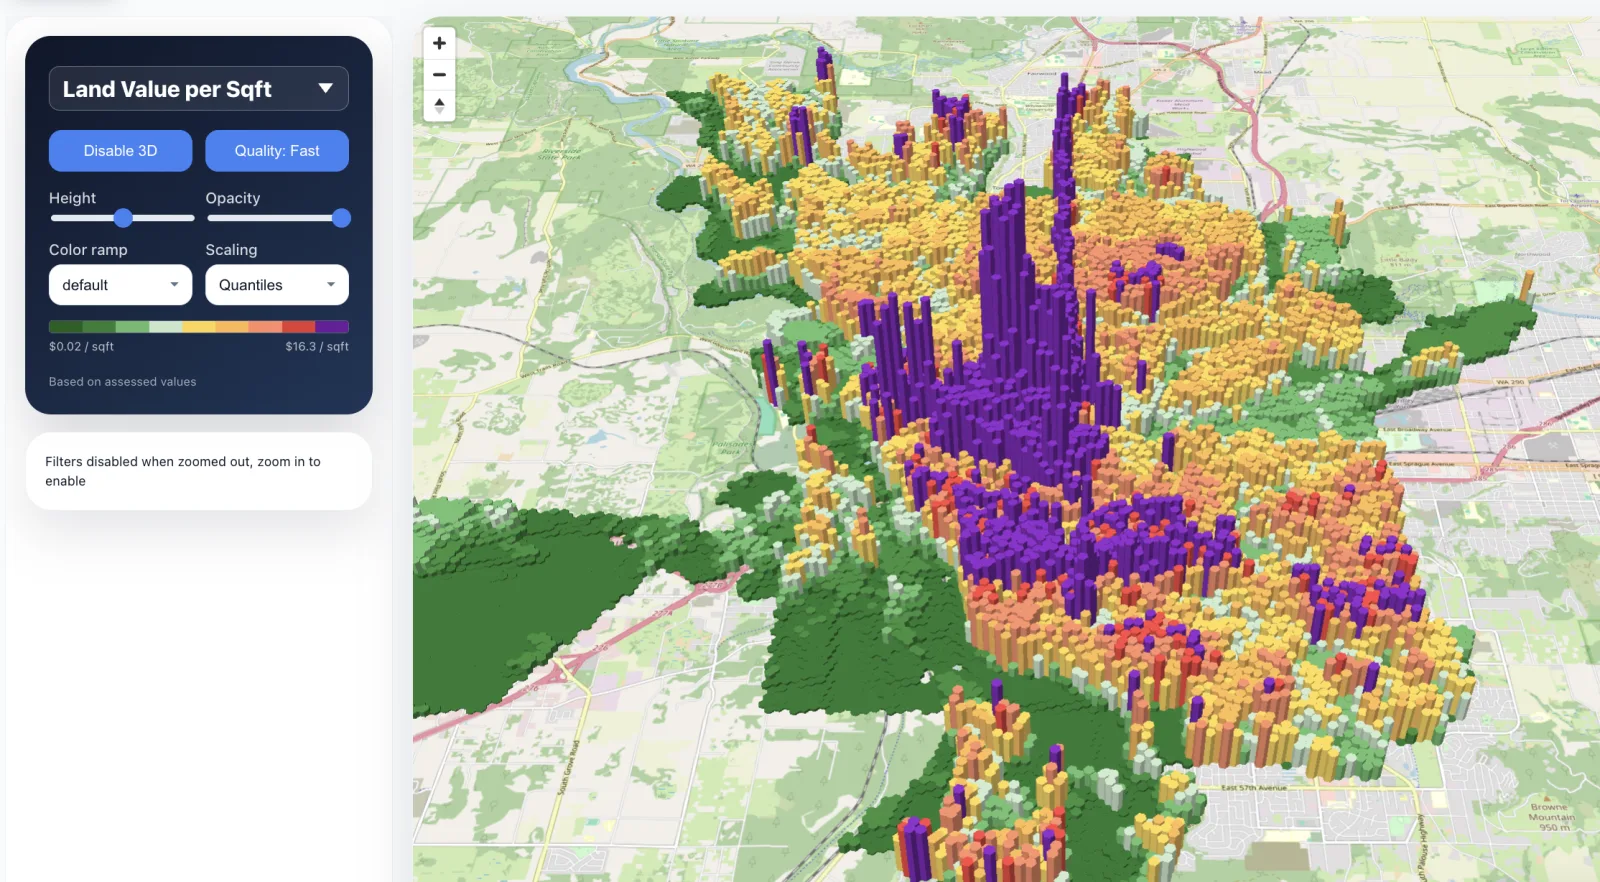
Every parcel, extruded by value
Each lot rises and shifts color with the value of the land beneath it. Read land value per square foot, total assessed value, building value, property tax, or the building-to-land ratio. Zoom from a citywide overview down to a single parcel, orbit in 3D, and recolor on the fly.
Vacant & Underdeveloped
Opportunity, made visible
CivicMapper isolates vacant lots, parking-lot parcels, and underdeveloped land, then totals the value sitting idle. In Spokane, that is roughly $1 billion in land — about 12% of the city's taxable land value — waiting to be put to use.
~$1B
of Spokane land sits idle — about 12% of its taxable land value
- Vacant lots
- ~$546M
- Underdeveloped
- ~$340M
- Parking-lot parcels
- ~$129M
Surface Parking
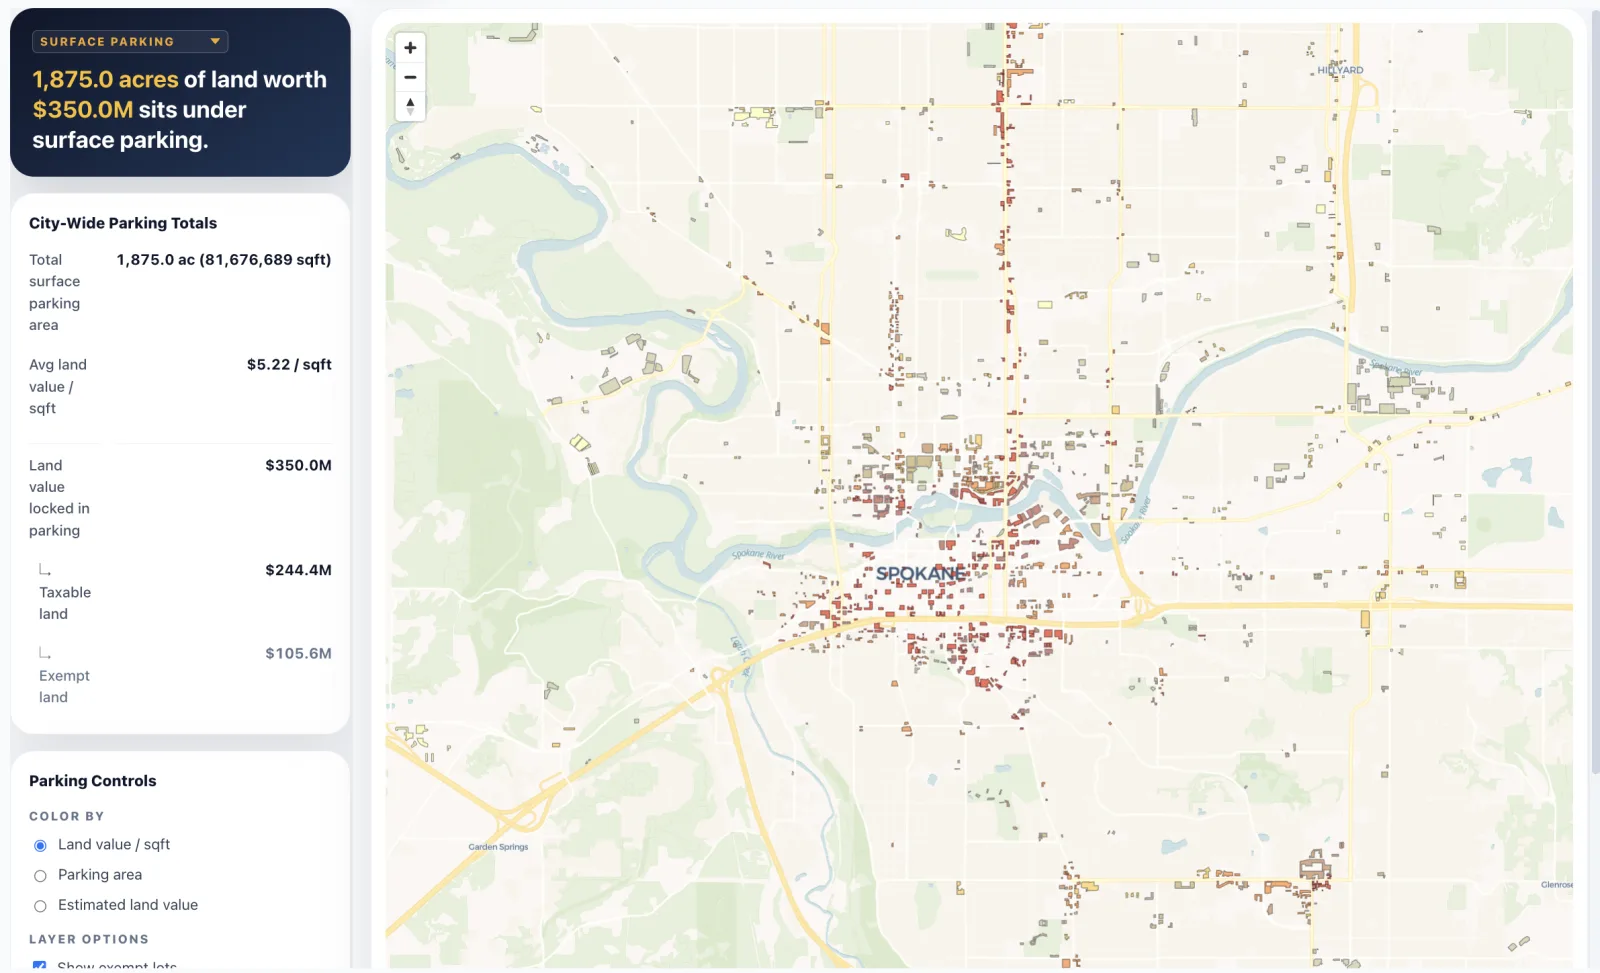
See what's paved over
Using OpenStreetMap and Overture building footprints joined to local assessment records, CivicMapper separates real surface lots from parking structures and adds up the land beneath them. In Spokane, 1,875 acres of surface parking sit on land worth about $350 million.
Coverage
Now mapping 25 cities across 14 states
New cities are added regularly through an open contribution pipeline.
Don't see your city? Visualize parcel data from anywhere with Put it on a Map, our free tool that needs no account — or get in touch to have your city added.
How it works
Open data. Open source.
Built on public records
Every city starts from official county and municipal assessment data — the same records governments already publish.
Free to explore
CivicMapper is free to use, supported by the Center for Land Economics' donors and funders. No paywall, no sales call.
Open and reproducible
The visualizer is open source and the data-processing pipeline is documented, so anyone can audit how a city's numbers were built.
Explore the land under your city
Pick a city and start mapping its land value, idle parcels, and surface parking in seconds.
Launch CivicMapper